Loading...

 USA
USA UK
UK Saudi Arabia
 UAE
UAE India
India Pakistan
 Australia
 New Zealand
 Canada
 Malaysia
 Philippines
  Georgia
  Nigeria
  Egypt
Egypt Data Analytics
What is ETL, ELT and Why?
ETL is a data integration process that helps organizations extract data from various sources and bring it into a single database.
ETL involves three steps:
Extraction : Data is extracted from source systems—SaaS, online, on-premises, and others—using database queries or change data capture processes.
Transformation: Data is then cleaned, processed, and turned into a common format so it can be consumed by a targeted data warehouse, database, or data lake.
Loading : Formatted data is loaded into the target system. This process can involve writing to a delimited file, creating schemas in a database, or a new object type in an application.
ELT is a data integration process that transfers data from a source system into a target system without business logic-driven transformations on the data.
ELT involves three stages:Extraction : Raw data is extracted from various sources, such as applications, SaaS, or databases.
Loading : Data is delivered directly to the target system – typically with schema and data type migration factored into the process.
Transformation : The target platform can then transform data for reporting purposes.
Why Do I Need It? Is that the same as a data warehouse? The world of data is almost unrecognizable. In reality, most organizations today understand the value of storing and managing their data to optimize their performance and to remain competitive in their market space. We all recognize that better information leads to better decisions, and an effective data solution, along with a new data “culture” makes this possible. Most businesses have no shortage of data, but organizing that data for easy access and new insights is a challenge that requires more than just data storage in a warehouse. So ETL/ELT helps us in reading/writing data into Data Warehouse, Data Lake, Data Marts, etc.
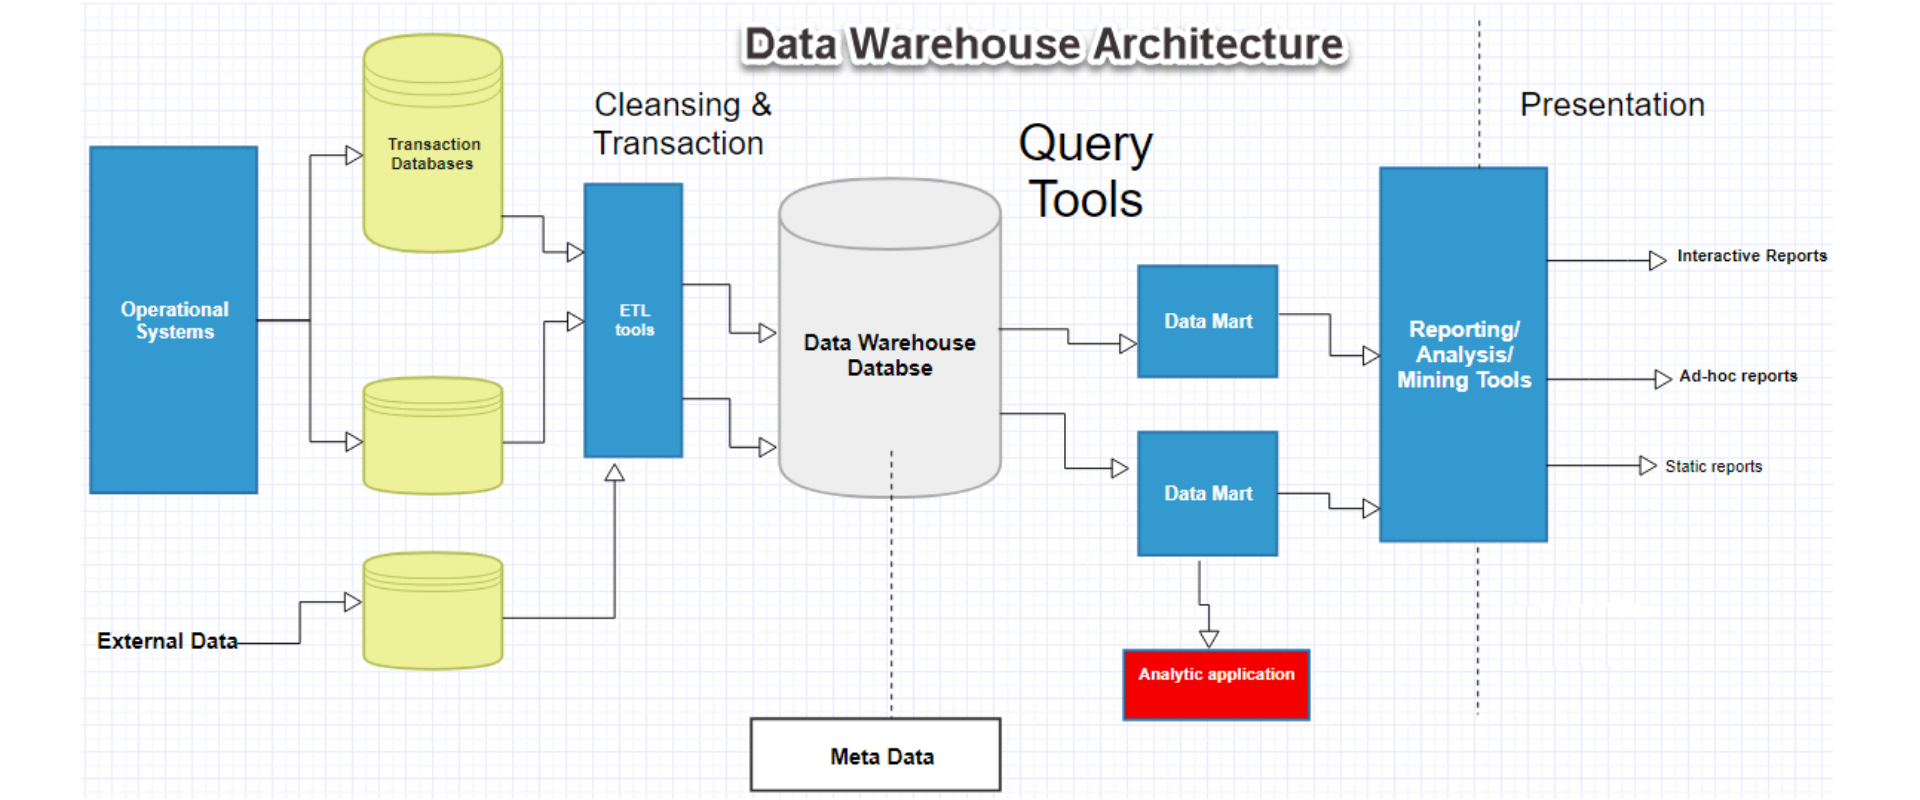
What is Data Warehouse, Data Lake
A data warehouse is a central repository of information that can be analyzed to make more informed decisions. Data flows into a data warehouse from transactional systems, relational databases, and other sources, typically on a regular cadence. Business analysts, data engineers, data scientists, and decision makers access the data through business intelligence (BI) tools.
What are the benefits of using a data warehouse?
Informed decision making
Consolidated data from many sources
Historical data analysis
Data quality, consistency, and accuracy
Separation of analytics processing from transactional databases, which improves performance of both systems
A data lake is a centralized repository that allows you to store all your structured and unstructured data at any scale. You can store your data as-is, without having to first structure the data, and run different types of analytics—from dashboards and visualizations to big data processing, real-time analytics, and machine learning to guide better decisions.
Why do you need a data lake?
Organizations that successfully generate business value from their data, will outperform their peers. An Aberdeen survey saw organizations who implemented a Data Lake outperforming similar companies by 9% in organic revenue growth. These leaders were able to do new types of analytics like machine learning over new sources like log files, data from click-streams, social media, and internet connected devices stored in the data lake. This helped them to identify, and act upon opportunities for business growth faster by attracting and retaining customers, boosting productivity, proactively maintaining devices, and making informed decisions.
Data Lake Architecture
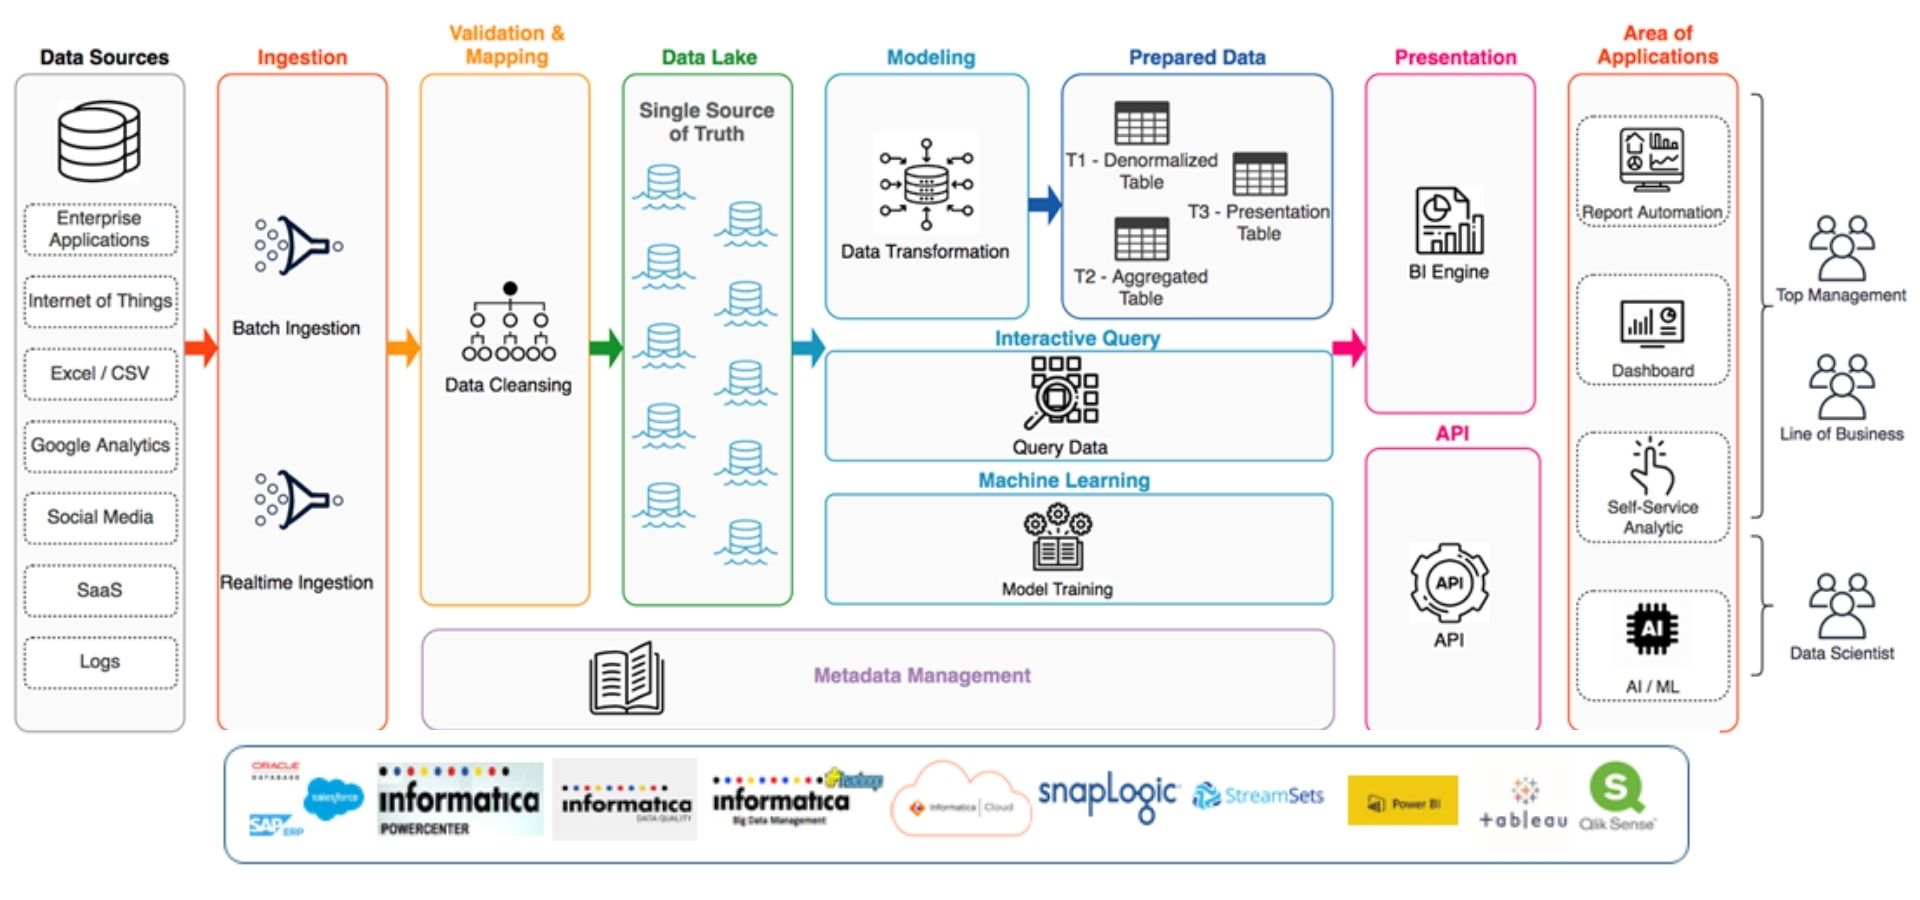
Systems Connected


ETL Tools Used
Informatica PowerCenter
Informatica Data Quality
Informatica Big Data Management
Informatica Cloud Data Integration
Snap logic
Talend Data Integration
Apache Nifi
Hadoop
Google Cloud Data Fusion
StreamSets Open Source version


Case Study-1
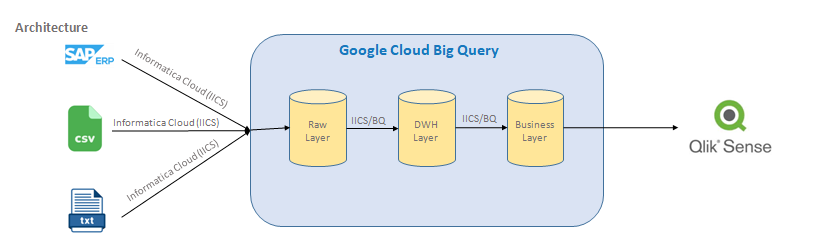
Problem: One of the largest Health care equipment distributer unable to pull most of the information from their data residing inside SAP ERP system. Customer is spending lot of efforts in generating reports that are required by different teams, which in return causing delay in taking key decisions.
Solution: Build a data lake by replicating raw data from their application tables to a layer in Big Query and develop Data Warehouse based on certain Inventory, Sales KPIS. These KPIS will be represented in the Qlik Sense dashboard which provide insights.
Case Study-1 KPI’s
Executive KPI’S
Actual VS Budget Comparison of Net Sales After Discount and Gross Profit Prior to Distribution Expense.Break-up of Sales by Invoice Type (Standard, FDI ) and FDI Type (Minibar, VIPs).
Customers and Products wise growth and decline compared to previous Year with Top N analysis.
Prior Period Comparison of Net Sales After Discount and Gross Profit Prior to Distribution Expense.
Analysis of 'Inventory on hand' and comparison with targets.
Analysis of 'Inventory Turns' and comparison with targets.
Analysis of 'At Risk' Inventory and comparison with targets.
Analysis of Operations KPIs and comparison with targets (Accounts Receivable, Days Sales Outstanding, Payments Collected, ADFI Outstanding, Chargeback Outstanding)
Trend Analysis of all of the above.
Proactive Alerts on the above.
Root-Cause analysis of Trend deviations through dimensional slice-n-dice.
Sales KPI’S
Prior Period Comparison (M-O-M, Q-O-Q, Y-O-Y) and MTD, QTD and YTD trends by Product Group (Profit Centre), manufacturer, Customer: GPO, Sub-GPO, IDN, Sub-IDNAnalysis of Actual VS Forecasted sales and Gross Profit (Margin including prompt pay discounts and purchase incentives)
Tabular Analysis for reporting
Analysis of 'Inventory on hand' with ability to drill-down into Inventory Type (Plant, FDI ) and FDI Type (Minibar, VIPs)
At Risk Inventory Calculated using the previously reviewed algorithm (utilizing run-rate and time till expiration)
Geographic Analysis: Break-up of Sales and Profit by geography and Territory Managers
Same As above, The dashboards help them in the forecasting process through the curated actual sales data and Dimensional slice-n-dice
Case Study-2
Problem: Unable to get executive level business insights to monitor Magento/Marketo's Combined business performance
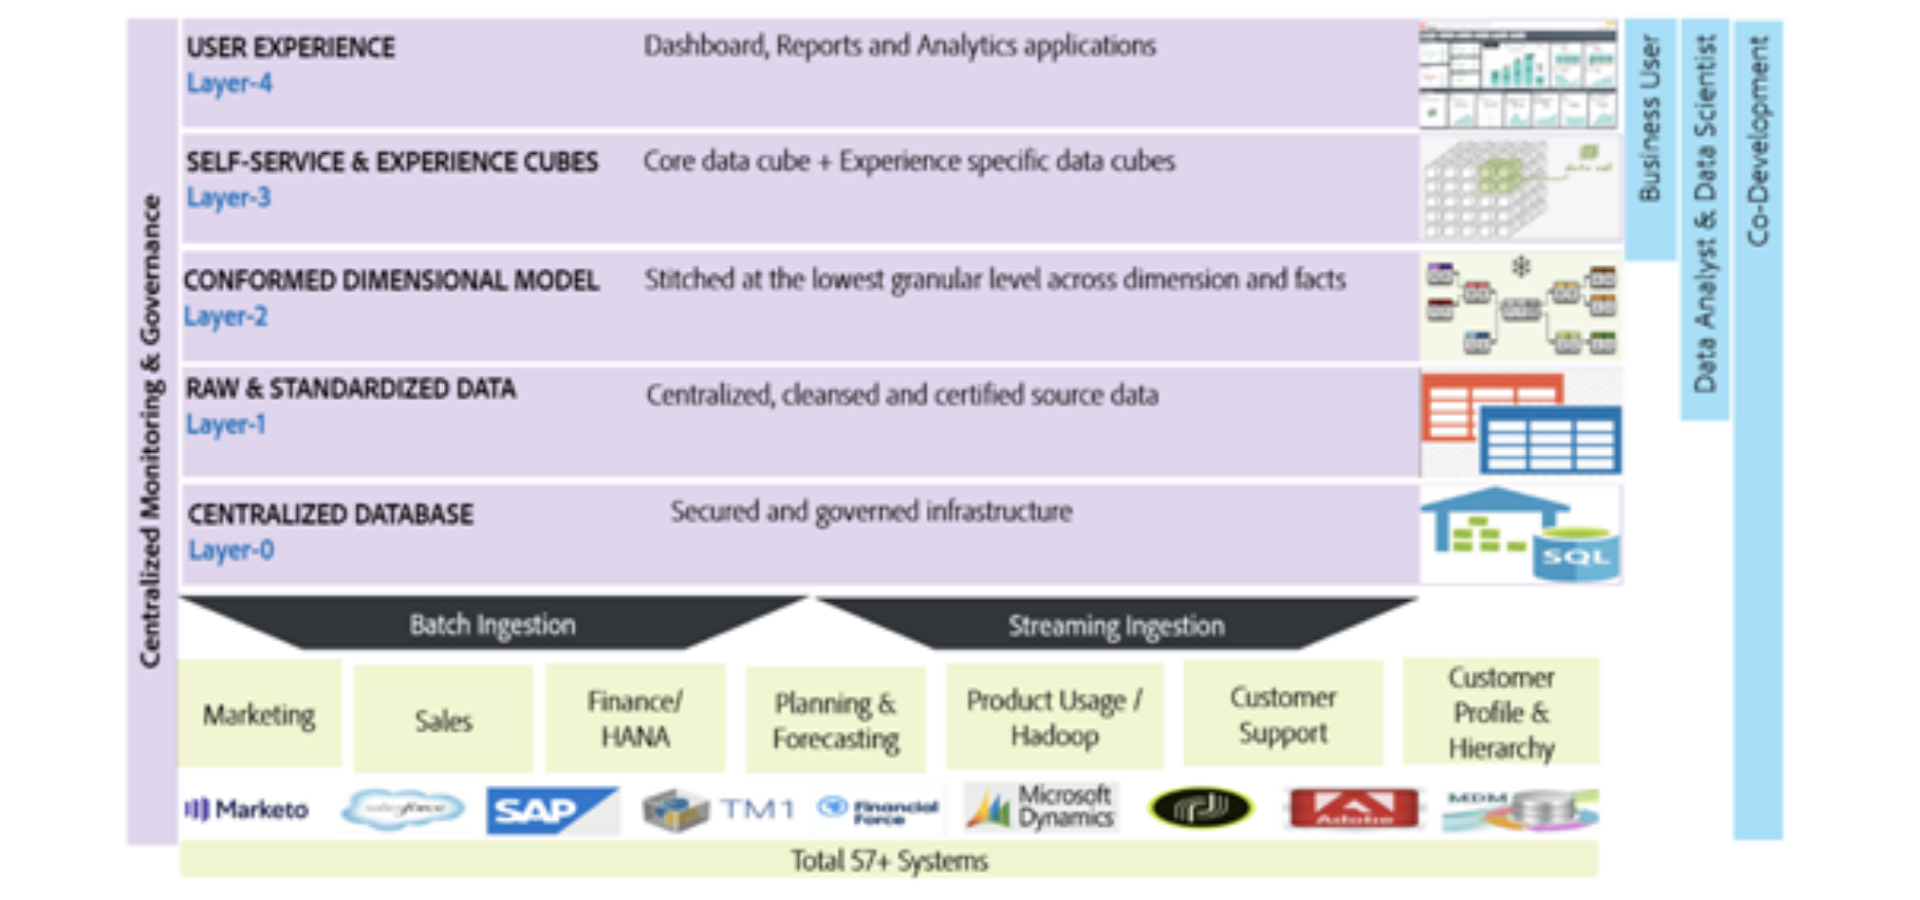
Solution: Centralize Enterprise Data Objects from across the customer Journey to organize as different layers serving the needs for different personas
Collection of centrally managed, governed, and monitored reusable business data objects built by co-development teams to support N number of insights and experiences. This centralized layer spans all enterprise business domains and comprises multiple layers to serve different business personas and diverse business requirements.
A collection of raw data objects from various source systems supporting the E2E enterprise business in a standardized, secured and organized manner with consistent SLAs, defined stewards, and operational monitors developed by enablement teams that serve as the foundational layer. These data objects will serve as the building blocks for Layer 2, Layer 3, and Layer 4.
A collection of raw data objects from various source systems supporting the E2E enterprise business in a standardized, secured and organized manner with consistent SLAs, defined stewards, and operational monitors developed by enablement teams that serve as the foundational layer. These data objects will serve as the building blocks for Layer 2, Layer 3, and Layer 4.
Service Offerings
Having a dedicated team of resources who has vast experience in implementing Data Analytic solutions.
Domains Worked for:
US Title InsuranceEcommerce(Marketing & Sales)
Supply Chain (HealthCare Products)
Insurance(Life, Health)
Delivery
Design and Development of Data Warehouse/Data Lake Solution.Develop Data Integration Processes.
Performance tuning of existing Data Integration Processes.
Maintain Existing Data Warehouse/Data Lake.
Develop Business Insights Dashboards.